


Monitoring the Parliament of Navarre. Series of reports about the legislators’ salaries, attendance and participation Project submitted for the Data Journalism Awards 2015 of Global Editors Network
The Journalistic Innovation Lab of the Diario de Navarra (DN Lab) has analyzed and compared the payments, attendance and interventions of the members of the Parliament of Navarre in a series of three multimedia reports. This is the first time in the 35-year history of this Chamber that a media inspects the activity and the salaries of its legislators, resulting in ten graphs and interactive visualizations based on our own database.
The series, which was published divided in three parts at Diariodenavarra.es, was created as a local project of data journalism. In this series, we combined several pieces of information which allow citizens to analyze the legislative activity of each member of the Parliament individually.
The first part of the project, “In-depth study of the members of the Parliament of Navarre“, is a visual examination of each legislator’s profile, including their salaries and expenses as reported in 2014. The interactive visualization was developed using information from the Transparency site of the Parliament of Navarre, political party websites, the official profiles of the legislators in social networks and Google Maps.
In this multimedia report we highlight that the members’ payments in 2014 amount to 2,427,438 euros. We revealed 82% of legislators have a minimum gross salary of 49,422 euros (The national minimum wage is 9,080.40 euros). We also emphasized women occupy 42% of the 50 seats, 44% of the members of the Parliament are in their first term, while almost a fifth part has been legislating in the Parliament of Navarre for at least 12 years.
Interactive visualization developed with D3.js technology
Starting from the salaries of 2013, which were published on the website of the Parliament, we created the outline of the database, to which we added columns in order to create a complete profile of each member of the Parliament including data such as name, political party, gender, age, date of birth , place of origin, address, distance from place of residence to Pamplona, start date of parliamentary activity, seniority, regime of dedication, gross and net salary, social security contributions, mileage expenses, travel expenses and total remuneration. Then, when wages paid in 2014 were published in January 2015, these data were also included in new columns.
We were able to extract some blocked data from the website of the Parliament of Navarre by using “scraping” techniques, such as the link to the official photo of each member of the Parliament, his full name and the party to which he belongs. After extracting the desired information we used Open Refine to clean the database, unify repeated entries, delete unwanted characters and give the database an appropriate format to work with it in Tableau.
We created other columns based on our own calculations and the previously gathered information: percentage of deduction on personal income tax, distance in kilometers from each municipality to the Parliament of Navarre and travel estimation from the place of residence to the seat in Pamplona according to the billed money. We used Google Maps in order to carry out those tasks. Totally, there were 29 criteria for each of the 50 members of the Parliament.

The database of the members of the Parliament of Navarre has 29 elements and is downloadable
In an exercise of transparency and to promote open data, we published the database in xls and csv formats, open to corrections and suggestions and available for download and reuse.
The main visualization was made from a program code developed using D3.js technology and published at Github during the “II Workshop of Data Journalism Medialab Prado” (II Taller de Periodismo de Datos Medialab Prado) licensed under “Creative Commons”. Other interactive graphs of the first report present through Tableau the costs and distances according to the mileage and the list of senior members of the Parliament.
The second installment of the project, “If attendance was taken at the Parliament” is an analysis of the attendance of the legislators of Navarre to the formal meetings of 2014. As in the first part, all the documents published in the Transparency Portal of the Parliament of Navarre from which data were extracted were only available in pdf format, which is a non-reusable format.

The ranking of attendances has two tabs with the list of legislators with the most and the least presence in 2014
In this report, we published a ranking of the members of the Parliament with the most and the least presence in 2014, in which we may see a difference of attendance among them which is up to 280. An interactive graph of the attendance-salary correlation also demonstrated how members with the same salary and dedication regime attended 228 sessions while others only attended 95.
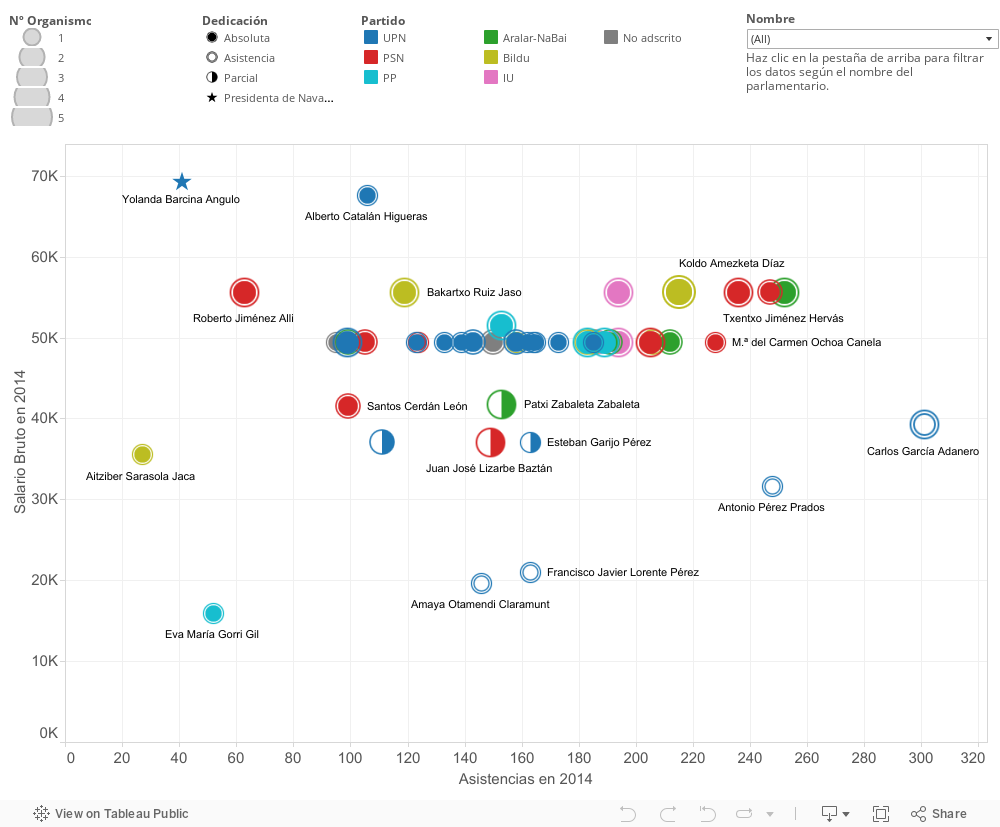
Interactive graphic with the correlation between salaries and attendance of legislators during 2014
In order to find the number of attendances per month of each legislator we extracted information from the pdf documents, dividing the sessions in which each legislator participated by organisms (Plenary Assembly, Board, Committee and Presentation). Although the documents indicate the total number of people attending, we manually verified each list since we found some errors in the total sum in five of the 50 members of the Parliament.

PDF that accounts erroneously the total number of attendances of one of the parliamentarians
Comentarios